Cedalion
Cedalion
A Python framework for the data-driven analysis of functional near-infrared spectroscopy (fNIRS) and diffuse optical tomography (DOT) in naturalistic environments. Developed by the Intelligent Biomedical Sensing (IBS) Lab with and for the community. With special thanks to the BOAS Lab at Boston University’s Neurophotonics Center for countless contributions.
Note
You are reading the documentation for the latest development version. Use the version switcher (top-left of the page) to select documentation for a specific release that matches your installed package.






Features at a glance
Cedalion covers the full fNIRS and DOT analysis pipeline. Click a panel to jump to the matching documentation page or example notebook.
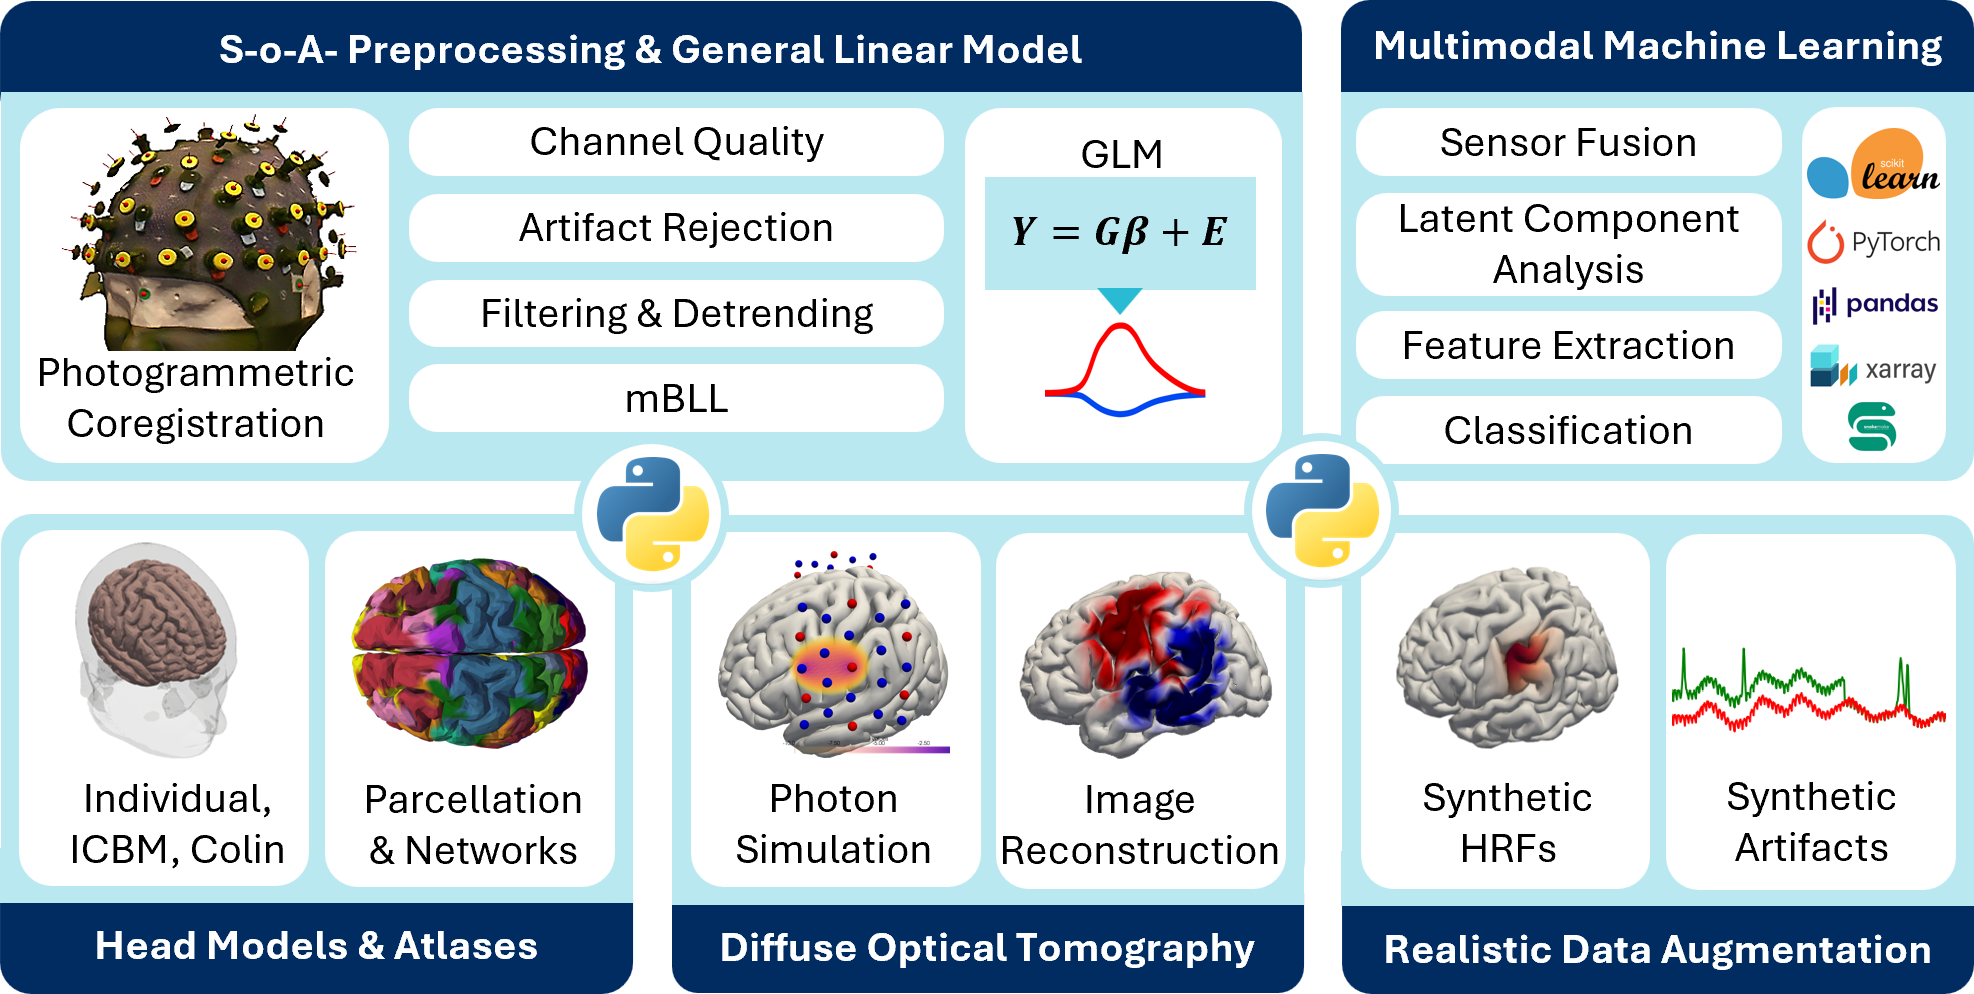
Preprocessing & GLM Photogrammetric coregistration Channel quality Artifact rejection Filtering & detrending Modified Beer-Lambert law General linear model Multimodal machine learning Sensor fusion Latent component analysis Feature extraction Classification Head models Parcellation & networks Head models & atlases Photon simulation Image reconstruction Diffuse optical tomography Synthetic HRFs Synthetic artifacts Realistic data augmentation
Where to find what
What is Cedalion?
Cedalion covers the full fNIRS and DOT analysis pipeline: from raw light intensity through signal quality assessment, preprocessing, and hemodynamic modeling to image reconstruction and statistical inference. It is designed for researchers who want transparent, reproducible, and extensible analysis rather than black-box processing.
The toolbox is built on a modern Python scientific stack — xarray for labeled multi-dimensional arrays, pint for physical unit tracking, and MNE for EEG/fNIRS integration — and is compatible with the SNIRF and BIDS data standards. All data transformations preserve axis labels and physical units by design, making it straightforward to trace results back to their neuroimaging origin.
Quick Start
The following snippet loads a bundled finger-tapping dataset and converts amplitude measurements to haemoglobin concentration in five lines:
import cedalion
import cedalion.nirs.cw as nirs
import xarray as xr

rec = cedalion.data.get_fingertapping()          # load Recording (auto-downloaded)
od  = nirs.int2od(rec["amp"])                    # amplitude → optical density
dpf = xr.DataArray([6.0, 6.0], dims="wavelength",
                   coords={"wavelength": od.wavelength})
conc = nirs.od2conc(od, rec.geo3d, dpf)          # OD → HbO / HbR (µM)
How to cite
If you use Cedalion in your research, please cite the tutorial paper:
Middell, E., Carlton, L. B., Moradi, S., Fischer, T., Cutler, J., Kelley, S. M., Behrendt, J., Dissanayake, T., Yücel, M. A., Boas, D. A., & von Lühmann, A. (2026). Cedalion tutorial: A Python-based framework for comprehensive analysis of multimodal fNIRS and DOT from the lab to the everyday world. Neurophotonics, 13(S3), 1–27. https://doi.org/10.1117/1.NPh.13.S3.S32602
@article{Middell2026,
  author  = {Middell, Eike and Carlton, Laura B. and Moradi, Shakiba and
             Fischer, Thomas and Cutler, Josef and Kelley, Shannon M. and
             Behrendt, Jacqueline and Dissanayake, Theekshana and
             Y{\"u}cel, Meryem A. and Boas, David A. and von L{\"u}hmann, Alexander},
  title   = {Cedalion tutorial: A {Python}-based framework for comprehensive
             analysis of multimodal {fNIRS} and {DOT} from the lab to the
             everyday world},
  journal = {Neurophotonics},
  volume  = {13},
  number  = {S3},
  pages   = {1--27},
  year    = {2026},
  doi     = {10.1117/1.NPh.13.S3.S32602}
}
Many functions implement methods from other publications. Their docstrings link to the original papers, collected in the bibliography; please cite those as well when you use them.
Partners and Funding





Version
This documentation was built from commit 730c3e2.