Tutorial Notebooks
The Cedalion tutorial accompanies the toolbox paper and walks through a complete analysis pipeline from raw data to image reconstruction and data-driven analysis. All seven notebooks are self-contained and fully executable; each builds on the concepts introduced in the previous one.
Prerequisites: a working Cedalion installation (see Installation) and basic familiarity with Python and numpy. Alternatively, you can run all notebooks on the cloud using Google Colab without any local installation, see Running Notebooks in Google Colab. No prior fNIRS knowledge is assumed — the first notebook introduces the measurement physics.
Estimated time: approximately 1–2 hours for the full sequence, or 15–30 minutes per notebook.
# |
Notebook |
What you will learn |
|---|---|---|
1 |
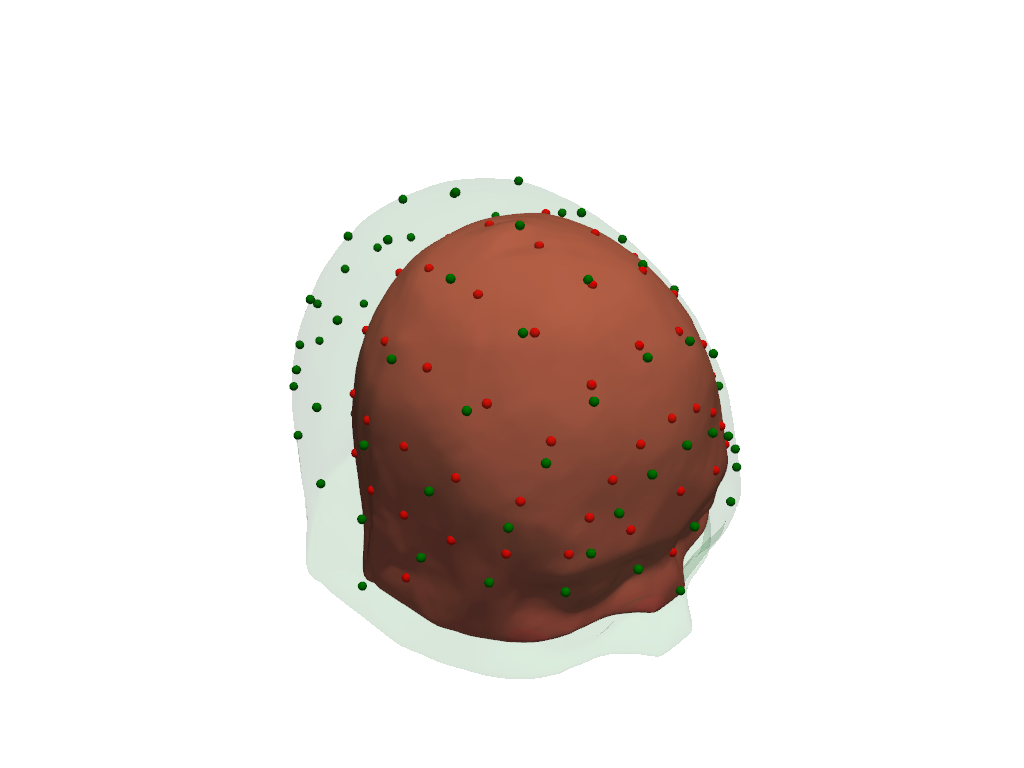
Heads and Forward Models |
Head model construction, mesh representations, coordinate systems, and building the DOT forward model. |
2 |
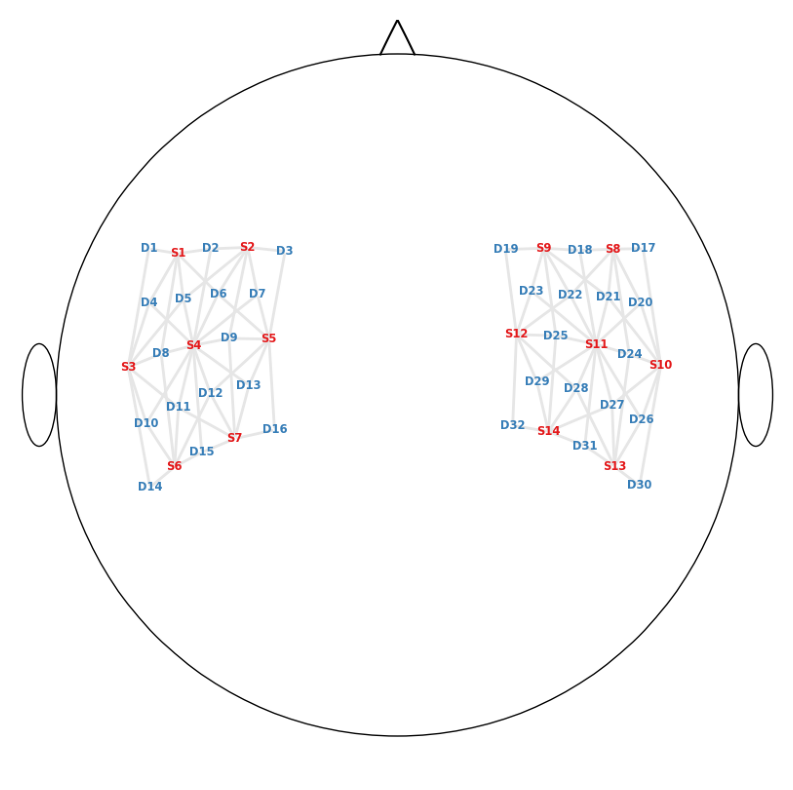
Photogrammetry |
Registering digitised optode positions to the head model using photogrammetric scalp surface matching. |
3 |
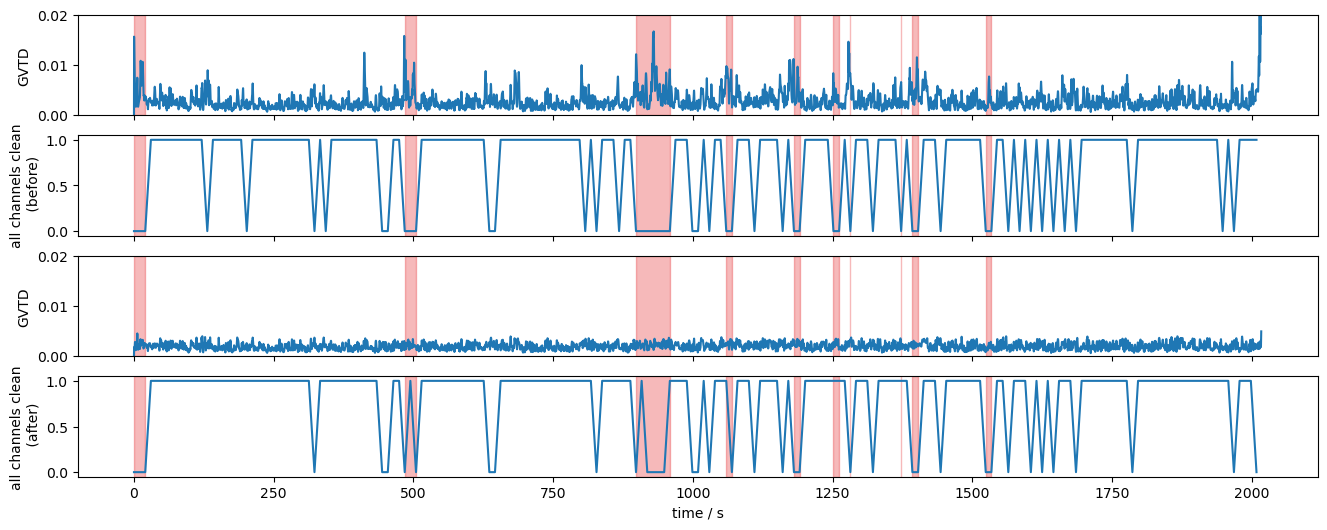
Signal Processing |
The full preprocessing pipeline: quality assessment, motion correction, temporal filtering, and haemoglobin conversion. |
4 |
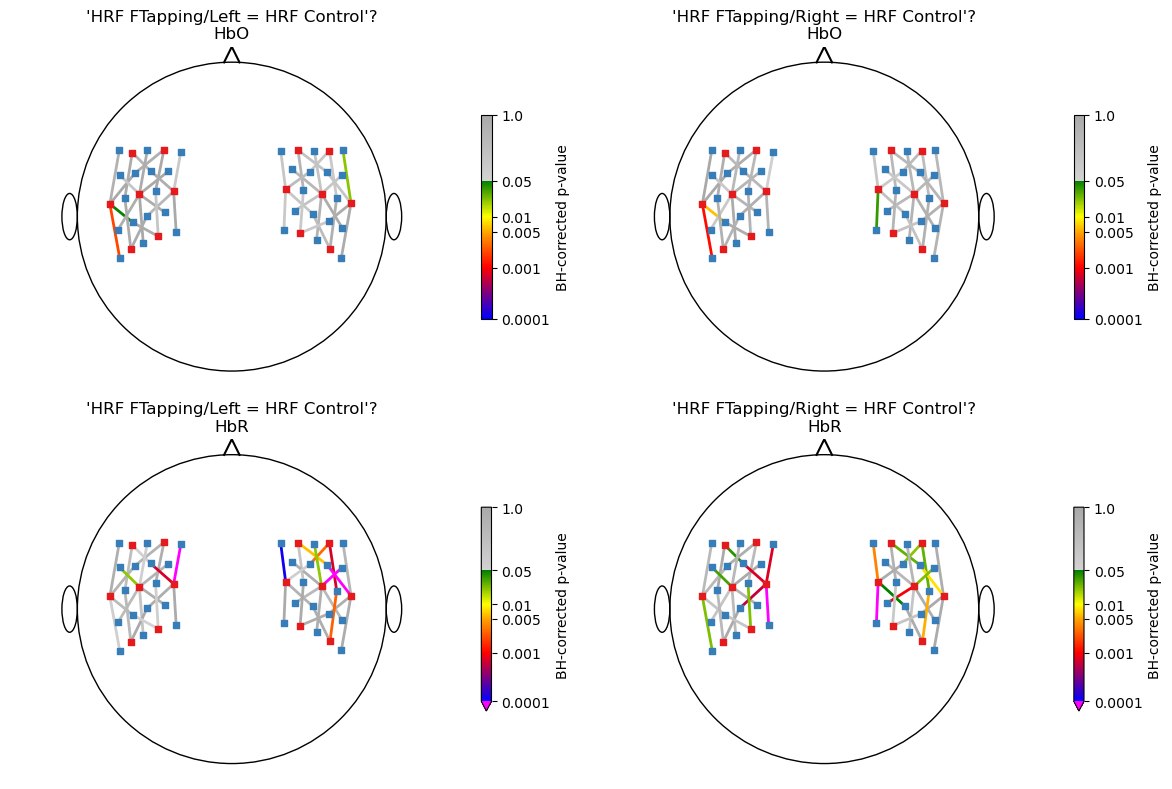
Model-driven Analysis |
GLM design matrices, HRF basis functions, beta estimation, and contrast maps. |
5 |
Image Reconstruction |
Computing the sensitivity matrix and reconstructing cortical haemodynamic images from channel-space data. |
6 |
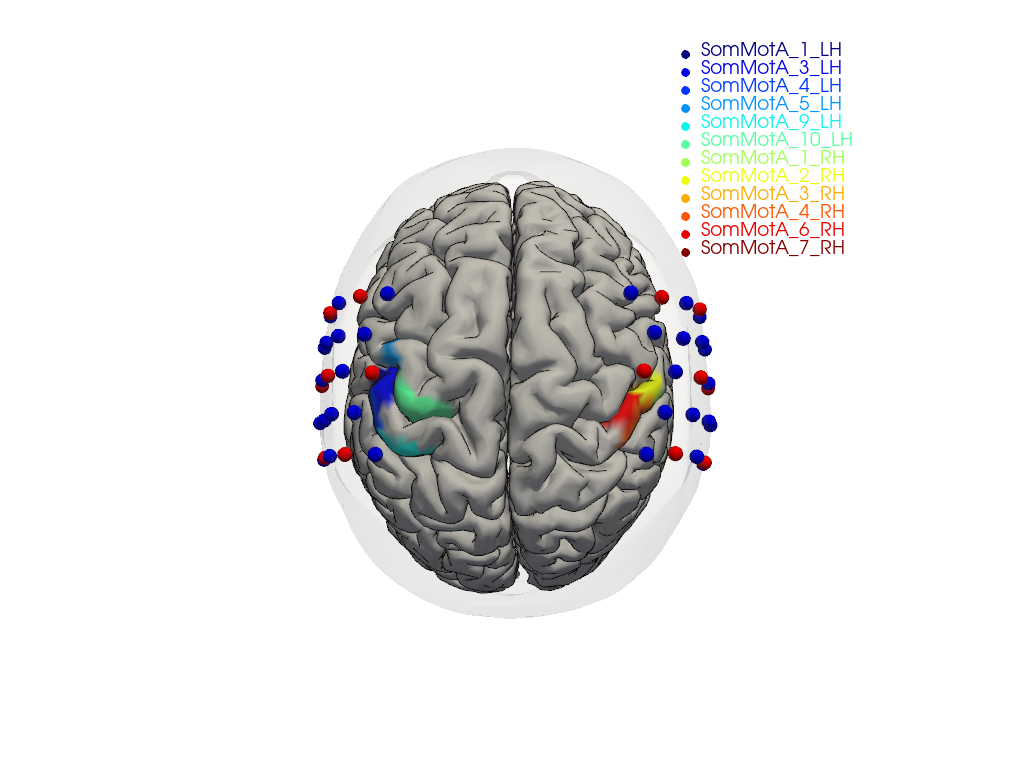
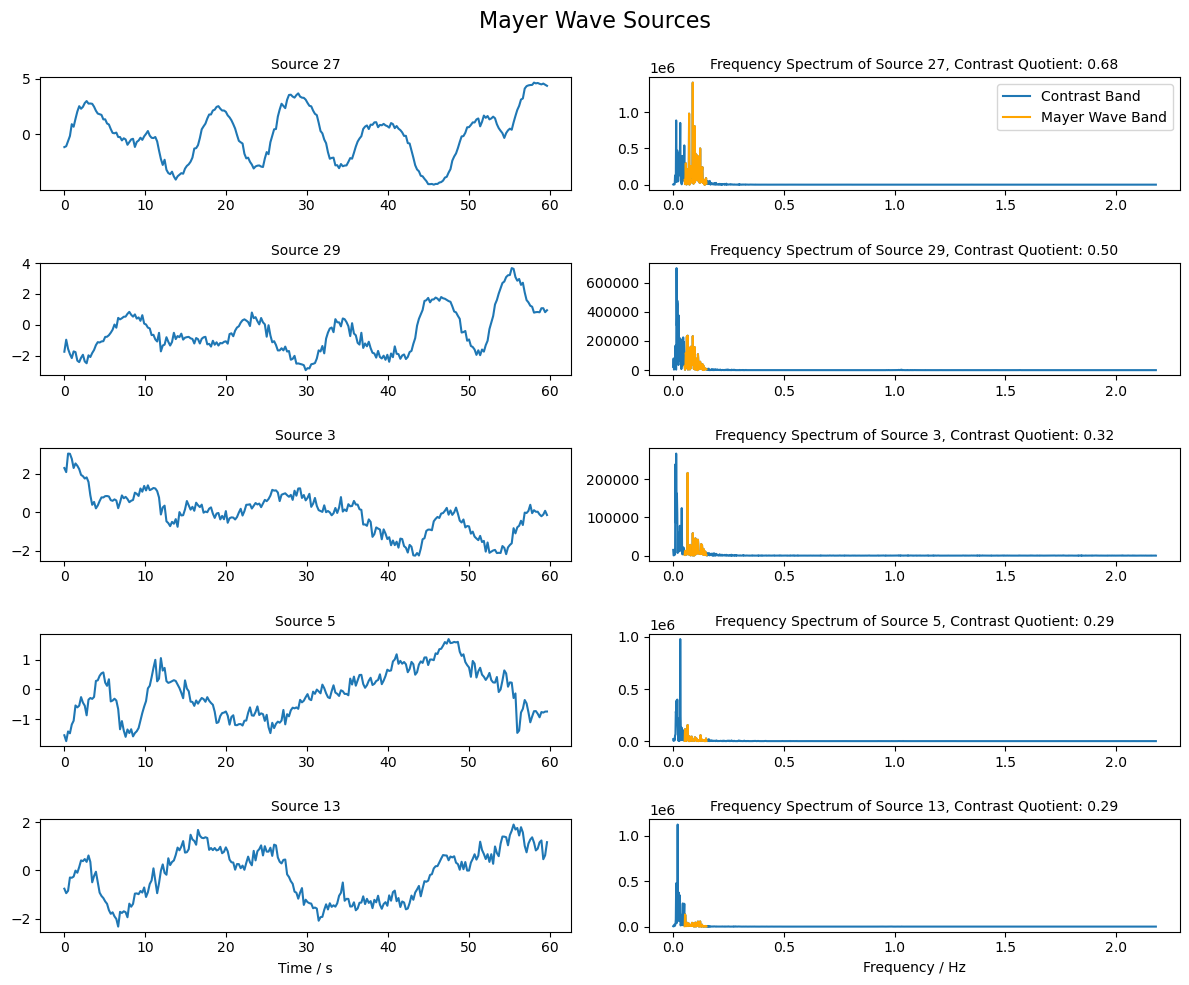
Data-driven Analysis |
CCA and ICA for identifying shared structure in fNIRS data without a stimulus model. |
7 |
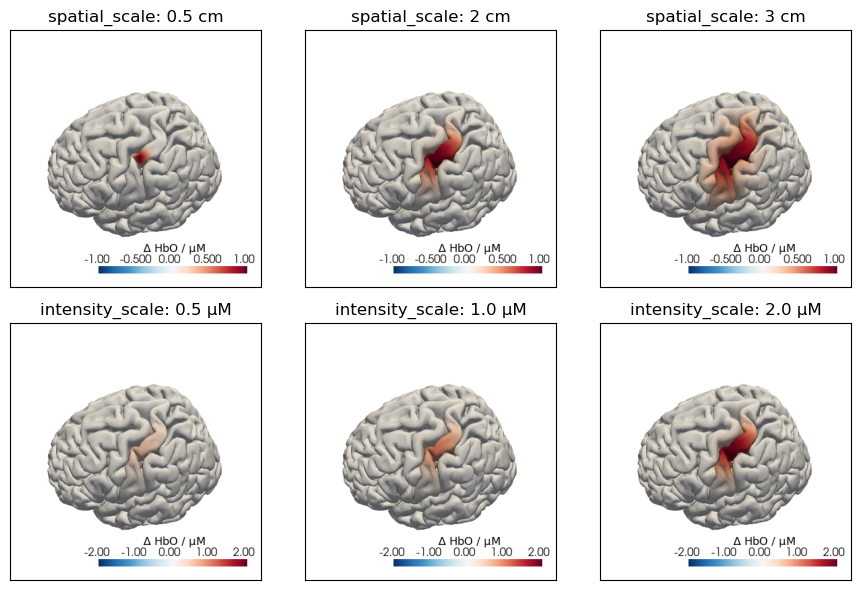
Data Augmentation |
Generating synthetic HRFs and motion artefacts for algorithm benchmarking. |