
Assigning AAL3 and Brodmann Atlas Labels to Brain Surfaces
This notebook assigns AAL3 and Brodmann atlas labels to the Colin27 and ICBM152 brain surfaces, visualizes the labels, and summarizes their overlap with the Schaefer2018 parcels.
Overview
Neuroimaging atlases — parcellations that divide the cerebral cortex into anatomically or functionally defined regions — are a cornerstone of group-level fNIRS and DOT analysis. Atlases allow researchers to:
Report results in a standardised anatomical vocabulary that is comparable across studies and laboratories.
Aggregate channel or vertex signals into region-of-interest (ROI) time series, reducing the multiple-comparisons burden.
Cross-reference DOT activations with the large fMRI literature, where the same atlas labels are widely used.
The two MNI spaces: MNI152 and MNI305
Two MNI variants are in common use and it is important to keep them distinct:
Space |
Template |
Typical users |
|---|---|---|
MNI152 |
Average of 152 adult brains (ICBM152 template) |
FSL, recent SPM, most modern atlases |
MNI305 |
Average of 305 brains; the original MNI reference |
FreeSurfer, older SPM, some legacy atlases |
MNI152 and MNI305 differ by a small affine shift (a few millimetres in some regions) and are not interchangeable. Cedalion stores a pre-computed affine transform (cedalion.dot.utils.mni305_to_mni152) and applies it automatically when a NIfTI is declared as voxel_label_crs='mni305', so you do not need to handle the conversion manually. Both spaces are fully supported; you simply specify which one your NIfTI file uses.
What this notebook demonstrates
This notebook shows the general workflow for applying any user-supplied parcellation scheme — provided as a NIfTI label volume in either MNI152 or MNI305 space — to the Cedalion head models. The workflow is illustrated with two widely used atlases:
AAL3 (Automated Anatomical Labelling atlas, version 3) [RHL+20] — 170 macro-anatomical regions covering the entire cerebral cortex and subcortex.
Brodmann areas (Mai–Majtanik atlas) [MM17] — the classical cytoarchitectonic map, available as a volumetric MNI label file.
Both atlases are bundled with Cedalion and loaded via cedalion.data.get_atlas_files(). The same code applies unchanged to any other NIfTI atlas you supply.
For more detail, see also:
43a_head_models_overview.ipynb — introduction to
TwoSurfaceHeadModeland the Schaefer2018 parcellation bundled with the standard models43b_individualized_head_models.ipynb — building an individualized head model from a subject’s own MRI using FreeSurfer, which yields surface-native parcel labels with sharper boundaries than the volumetric approach shown here
[1]:
import json

import numpy as np
import pyvista as pv
from scipy.spatial import KDTree

import cedalion
import cedalion.dot
from cedalion.vis.anatomy import get_vertex_colors_from_coord, plot_brain_views_grid

pv.set_jupyter_backend("static")


def display_truncated_dict(d: dict):
    "Helper function for displaying long dictionaries."

    keys = list(d)[:5] + list(d)[-5:]
    display({k : d[k] for k in keys})
Loading Colin27 and ICBM152 Head Models
We load both standard atlas head models. Each is stored in voxel space (crs='ijk'); assign_parcels_via_mni_coords works in MNI152 space internally so the coordinate system of the loaded head model does not need to match that of the atlas.
Both models carry pre-computed mni152_r/a/s vertex coordinates on the brain surface, which is what makes the atlas transfer possible. The inflated cortex surfaces are loaded for visualization: inflation removes sulci and gyri so that buried cortex becomes visible, making parcel boundaries much easier to inspect.
[2]:
colin_ijk = cedalion.dot.get_standard_headmodel("colin27")
colin_inflated = cedalion.dot.get_inflated_cortex_surface("colin27")

icbm_ijk = cedalion.dot.get_standard_headmodel("icbm152")
icbm_inflated = cedalion.dot.get_inflated_cortex_surface("icbm152")
Loading Atlases
Atlases distributed for use with standard MNI templates typically come in two files:
A NIfTI volume (
.niior.nii.gz) in which every voxel inside a labelled region carries a positive integer, and background voxels carry 0 (or another reserved value).A label mapping (
.json,.csv, or.txt) that translates those integers to human-readable region names.
cedalion.data.get_atlas_files(name) returns both paths for the bundled atlases. For a custom atlas you can pass any NIfTI path you have downloaded or created.
AAL3 — Automated Anatomical Labelling atlas (version 3)
AAL3 [RHL+20] divides the cerebral cortex and subcortical structures into 170 macro-anatomical regions based on sulcal and gyral landmarks visible in the MNI152 template. It is one of the most widely used atlases in the fMRI and fNIRS literature and provides a common vocabulary for reporting results. The NIfTI file bundled with Cedalion is defined in MNI152 space.
[3]:
aal3_voxel_label_niftii, aal3_labels_json = cedalion.data.get_atlas_files("aal3")

# dictionary to map numeric voxel labels in nifti to string labels
with aal3_labels_json.open("r") as fin:
    aal3_num2label = json.load(fin)
    aal3_num2label = {i["index"] : i["name"] for i in aal3_num2label["labels"]}

# show some entries of the dictionary
display_truncated_dict((aal3_num2label))
Downloading file 'atlas_aal3.zip' from 'https://doc.ibs.tu-berlin.de/cedalion/datasets/dev/atlas_aal3.zip' to '/home/runner/.cache/cedalion/dev'.
Unzipping contents of '/home/runner/.cache/cedalion/dev/atlas_aal3.zip' to '/home/runner/.cache/cedalion/dev/atlas_aal3.zip.unzip'
{1: 'Precentral_L',
 2: 'Precentral_R',
 3: 'Frontal_Sup_2_L',
 4: 'Frontal_Sup_2_R',
 5: 'Frontal_Mid_2_L',
 166: 'Red_N_R',
 167: 'LC_L',
 168: 'LC_R',
 169: 'Raphe_D',
 170: 'Raphe_M'}
Brodmann Areas — Mai–Majtanik Atlas
Brodmann areas are the classical cytoarchitectonic map of the human cortex, originally defined by Korbinian Brodmann in 1909 from histological sections and still widely used to communicate the location of activations in the neuroscience literature. The Mai–Majtanik atlas [MM17] provides these areas as a digitised volumetric label map registered to MNI152 space, making it directly compatible with the Cedalion head models. Areas such as BA44/45 (Broca’s area) or BA17 (primary visual cortex) are convenient reference landmarks when linking fNIRS results to the broader neuroimaging literature.
[4]:
brodmann_voxel_label_niftii, brodmann_labels_json = cedalion.data.get_atlas_files("brodmann")

# dictionary to map numeric voxel labels in nifti to string labels
with brodmann_labels_json.open("r") as fin:
    brodmann_num2label = json.load(fin)
    brodmann_num2label = {i["index"] : i["name"] for i in brodmann_num2label["labels"]}

# show some entries of the dictionary
display_truncated_dict(brodmann_num2label)
Downloading file 'atlas_brodmann.zip' from 'https://doc.ibs.tu-berlin.de/cedalion/datasets/dev/atlas_brodmann.zip' to '/home/runner/.cache/cedalion/dev'.
Unzipping contents of '/home/runner/.cache/cedalion/dev/atlas_brodmann.zip' to '/home/runner/.cache/cedalion/dev/atlas_brodmann.zip.unzip'
{1: 'right_Ent',
 2: 'right_BA20',
 3: 'right_BA38',
 4: 'right_BA21',
 5: 'right_BA36',
 139: 'left_BA8',
 140: 'left_BA5',
 141: 'left_BA52',
 142: 'left_BA35',
 143: 'left_BA34'}
Brain Vertex Coordinates Before Atlas Assignment
The brain.vertices xarray DataArray already carries several vertex coordinates set when the head model was built from FreeSurfer outputs:
Coordinate |
Meaning |
|---|---|
|
Schaefer2018 parcel label [SKG+18] |
|
Corresponding vertex index in the FreeSurfer |
|
MNI152 RAS coordinates of the vertex in mm |
Calling assign_parcels_via_mni_coords will add a new named coordinate to this DataArray without removing or modifying any existing one. Multiple atlas labels can therefore coexist on the same vertex, which is what we exploit below.
[5]:
colin_ijk.brain.vertices
[5]:
<xarray.DataArray (label: 25000, ijk: 3)> Size: 600kB
<Quantity([[ 77.575966  19.290176  74.323414]
 [ 84.207517  19.202515  68.985718]
 [ 85.092731  19.342216  67.495901]
 ...
 [156.792999 124.600063  70.614239]
 [132.153282 182.175888  72.333395]
 [ 94.202573  52.128399 103.226031]], 'dimensionless')>
Coordinates:
  * label             (label) int64 200kB 0 1 2 3 4 ... 24996 24997 24998 24999
  * fsaverage_vertex  (label) int64 200kB 6 28 39 42 ... 333163 333191 333192
  * parcel            (label) object 200kB 'VisCent_ExStr_8_LH' ... 'VisPeri_...
  * mni152_r          (label) float64 200kB -11.62 -5.094 -4.239 ... 41.6 5.238
  * mni152_a          (label) float64 200kB -105.4 -105.4 -105.3 ... 58.39 -72.4
  * mni152_s          (label) float64 200kB 4.655 -0.753 -2.251 ... 0.446 32.95
Dimensions without coordinates: ijk
Assigning Atlas Labels to Brain Vertices
TwoSurfaceHeadModel.assign_parcels_via_mni_coords transfers labels from a volumetric NIfTI atlas to the brain surface by exploiting the MNI152 coordinates shared by both. The algorithm works as follows:
Coordinate alignment: The NIfTI affine transform is used to compute the MNI coordinate of every voxel centre. If the atlas is in MNI305 space (
voxel_label_crs='mni305'), the pre-computed affinecedalion.dot.utils.mni305_to_mni152is applied first to bring voxel coordinates into the same MNI152 frame as the head model vertices.Nearest-labelled-voxel search: A KD-tree is built from the voxel centres. For each brain surface vertex, all voxels within a ball of radius
mni_epsmm in MNI152 space are retrieved. Background voxels (label 0 or whichever integer maps tobackground_label) are excluded, and the closest labelled voxel is selected.Label assignment: The integer label of the winning voxel is translated to a string via
label_mappingand stored as a new vertex coordinate. If no labelled voxel falls withinmni_epsmm, the vertex receivesbackground_label.
Key parameters:
Parameter |
Effect |
|---|---|
|
Name of the new vertex coordinate (e.g. |
|
|
|
Path to the NIfTI atlas file |
|
MNI variant of the NIfTI: |
|
Search radius in mm (default |
Each call returns a new head model object; the original is not modified (immutable-style API). We chain two calls to assign both atlases in sequence.
Assigning AAL3 and Brodmann labels to the Colin27 head:
[6]:
# Colin27

colin_ijk_labeled = colin_ijk.assign_parcels_via_mni_coords(
    coordinate_label="parcel_aal3",
    label_mapping=aal3_num2label,
    voxel_label_niftii=aal3_voxel_label_niftii,
    voxel_label_crs="mni152",
    mni_eps=5
)

colin_ijk_labeled = colin_ijk_labeled.assign_parcels_via_mni_coords(
    coordinate_label="parcel_brodmann",
    label_mapping=brodmann_num2label,
    voxel_label_niftii=brodmann_voxel_label_niftii,
    voxel_label_crs="mni152",
    mni_eps=5
)


colin_ijk_labeled.brain.vertices
[6]:
<xarray.DataArray (label: 25000, ijk: 3)> Size: 600kB
<Quantity([[ 77.575966  19.290176  74.323414]
 [ 84.207517  19.202515  68.985718]
 [ 85.092731  19.342216  67.495901]
 ...
 [156.792999 124.600063  70.614239]
 [132.153282 182.175888  72.333395]
 [ 94.202573  52.128399 103.226031]], 'dimensionless')>
Coordinates:
  * label             (label) int64 200kB 0 1 2 3 4 ... 24996 24997 24998 24999
  * fsaverage_vertex  (label) int64 200kB 6 28 39 42 ... 333163 333191 333192
  * parcel            (label) object 200kB 'VisCent_ExStr_8_LH' ... 'VisPeri_...
  * mni152_r          (label) float64 200kB -11.62 -5.094 -4.239 ... 41.6 5.238
  * mni152_a          (label) float64 200kB -105.4 -105.4 -105.3 ... 58.39 -72.4
  * mni152_s          (label) float64 200kB 4.655 -0.753 -2.251 ... 0.446 32.95
  * parcel_aal3       (label) <U20 2MB 'Occipital_Mid_L' ... 'Cuneus_R'
  * parcel_brodmann   (label) <U10 1MB 'left_BA17' 'left_BA17' ... 'right_BA19'
Dimensions without coordinates: ijk
Because ICBM152 and Colin27 share the same MNI152 coordinate frame, the identical NIfTI atlas files and label dictionaries work unchanged for both head models. This is the practical benefit of the shared coordinate system: you write the atlas assignment code once and it applies to any head model that has MNI152 vertex coordinates.
Assigning AAL3 and Brodmann labels to the ICBM152 head:
[7]:
# ICBM-152

icbm_ijk_labeled = icbm_ijk.assign_parcels_via_mni_coords(
    coordinate_label="parcel_aal3",
    label_mapping=aal3_num2label,
    voxel_label_niftii=aal3_voxel_label_niftii,
    voxel_label_crs="mni152",
    mni_eps=5
)

icbm_ijk_labeled = icbm_ijk_labeled.assign_parcels_via_mni_coords(
    coordinate_label="parcel_brodmann",
    label_mapping=brodmann_num2label,
    voxel_label_niftii=brodmann_voxel_label_niftii,
    voxel_label_crs="mni152",
    mni_eps=5
)


icbm_ijk_labeled.brain.vertices
[7]:
<xarray.DataArray (label: 25000, ijk: 3)> Size: 600kB
<Quantity([[ 82.38296   25.730011 153.460623]
 [ 85.862961  25.402374 151.194828]
 [ 81.284366  25.63604  148.757538]
 ...
 [135.999569  40.828735 153.773928]
 [150.376545 170.899029 159.758125]
 [ 96.195767 102.627569 172.166557]], 'dimensionless')>
Coordinates:
  * label             (label) int64 200kB 0 1 2 3 4 ... 24996 24997 24998 24999
  * fsaverage_vertex  (label) int64 200kB 6 25 43 67 ... 321196 321203 321217
  * parcel            (label) object 200kB 'VisCent_Striate_2_LH' ... 'Backgr...
  * mni152_r          (label) float64 200kB -13.62 -10.14 -14.72 ... 54.38 0.196
  * mni152_a          (label) float64 200kB -106.3 -106.6 -106.4 ... 38.9 -29.37
  * mni152_s          (label) float64 200kB 5.461 3.195 0.758 ... 11.76 24.17
  * parcel_aal3       (label) <U20 2MB 'Occipital_Mid_L' ... 'Background'
  * parcel_brodmann   (label) <U10 1MB 'left_BA18' 'left_BA17' ... 'left_BA23'
Dimensions without coordinates: ijk
Plotting Parcellation Schemes
Cedalion’s surface plotting functions accept a list of per-vertex colors (RGB tuples or matplotlib color specs), one entry per vertex in vertex order. The helper cedalion.vis.anatomy.get_vertex_colors_from_coord builds this list from a named vertex coordinate and a color_mapping that translates string labels to colors.
Three color_mapping modes are supported:
|
Behaviour |
|---|---|
|
Each label is looked up; vertices not in the dict get |
|
A random but deterministic color is generated for every unique label |
A single color string (e.g. |
Every vertex whose label is in |
We first demonstrate with the Schaefer2018 parcellation that is bundled with the head model and has an official color map:
[8]:
# example: Schaefer parcel colors
schaefer_color_dict = cedalion.data.get_colin27_headmodel_files().load_parcel_colors()

# show only some items from the dict
display_truncated_dict(schaefer_color_dict)
{'VisCent_Striate_1_LH': [120, 18, 135],
 'VisCent_Striate_2_LH': [120, 18, 136],
 'VisCent_Striate_3_LH': [120, 18, 137],
 'VisCent_ExStr_1_LH': [120, 18, 128],
 'VisCent_ExStr_2_LH': [120, 18, 129],
 'TempPar_9_RH': [9, 41, 252],
 'TempPar_10_RH': [9, 41, 253],
 'TempPar_11_RH': [9, 41, 254],
 'TempPar_12_RH': [9, 42, 247],
 'TempPar_13_RH': [9, 42, 248]}
get_vertex_colors_from_coord iterates over every brain surface vertex, reads its label from the named coordinate, and returns the corresponding color from the mapping. Vertices whose label is not found in the mapping receive default_color (grey by default). The result is a list in the same vertex order as brain.vertices, ready to pass directly to any of the cedalion.vis plotting functions.
[9]:
vertex_colors = get_vertex_colors_from_coord(colin_ijk_labeled.brain, "parcel", color_mapping=schaefer_color_dict)
print(f"The brain surface has {colin_ijk_labeled.brain.nvertices} vertices.")
print(f"The list vertex_colors has {len(vertex_colors)} entries. These are the first entries:")
vertex_colors[:4]
The brain surface has 25000 vertices.
The list vertex_colors has 25000 entries. These are the first entries:
[9]:
[(0.47058823529411764, 0.07058823529411765, 0.5411764705882353),
 (0.47058823529411764, 0.07058823529411765, 0.5333333333333333),
 (0.47058823529411764, 0.07058823529411765, 0.5333333333333333),
 (0.47058823529411764, 0.07058823529411765, 0.5333333333333333)]
plot_brain_views_grid renders the brain surface from five standard viewpoints (superior, left, right, anterior, posterior) in a single figure. We pass the inflated surface here — which has the same vertex order as the pial surface — so sulcal cortex is unfolded and every parcel is visible at once.
The Schaefer2018 parcellation on the inflated Colin27 cortex:
[10]:
plot_brain_views_grid(colin_inflated, vertex_colors, reset_camera=True)

AAL3 Labels on Colin27
We now visualize the freshly assigned AAL3 labels. Because AAL3 does not ship with a canonical per-region color map, we pass color_mapping=None to let get_vertex_colors_from_coord generate colors automatically. The algorithm uses a deterministic golden-ratio hue spacing so colors are consistent across calls.
We show both the pial (folded) and the inflated surface. The inflated view makes buried sulcal cortex visible and allows you to judge where parcel boundaries fall relative to major anatomical landmarks. Notice that compared to the Schaefer2018 map above, some AAL3 borders appear slightly less crisp — this is the expected consequence of the volumetric-to-surface transfer (discussed in detail at the end of this notebook).
[11]:
vertex_colors = get_vertex_colors_from_coord(colin_ijk_labeled.brain, "parcel_aal3", color_mapping=None, default_color="magenta")

plot_brain_views_grid(colin_ijk_labeled.brain, vertex_colors)
plot_brain_views_grid(colin_inflated, vertex_colors, reset_camera=True)


Brodmann Labels on Colin27
The same workflow applied to the Brodmann atlas. Brodmann areas are fewer and larger than AAL3 regions. On the inflated surface the classical areas are clearly recognisable: BA4/6 along the central sulcus (motor/premotor), BA17/18/19 in the occipital lobe (visual cortex), and BA44/45 in the left inferior frontal gyrus (Broca’s area).
[12]:
vertex_colors = get_vertex_colors_from_coord(colin_ijk_labeled.brain, "parcel_brodmann", color_mapping=None)

plot_brain_views_grid(colin_ijk_labeled.brain, vertex_colors)
plot_brain_views_grid(colin_inflated, vertex_colors, reset_camera=True)


AAL3 Labels on ICBM152
The same atlas applied to the ICBM152 head model. Any differences from the Colin27 result reflect genuine anatomical differences between the two templates (single-subject average vs. group average) rather than any difference in the atlas or the transfer procedure.
[13]:
vertex_colors = get_vertex_colors_from_coord(icbm_ijk_labeled.brain, "parcel_aal3", color_mapping=None)

plot_brain_views_grid(icbm_ijk_labeled.brain, vertex_colors)
plot_brain_views_grid(icbm_inflated, vertex_colors, reset_camera=True)


Brodmann Labels on ICBM152
[14]:
vertex_colors = get_vertex_colors_from_coord(icbm_ijk_labeled.brain, "parcel_brodmann", color_mapping=None)

plot_brain_views_grid(icbm_ijk_labeled.brain, vertex_colors)
plot_brain_views_grid(icbm_inflated, vertex_colors, reset_camera=True)


Customizing Colors for ROI Highlighting
In practice you will often want to highlight a small set of regions of interest rather than visualize the entire atlas at once. get_vertex_colors_from_coord supports two convenience patterns for this.
Pattern 1 — selected parcels with distinct colors:
Pass a partial color_mapping dict containing only the regions you care about. All other vertices receive default_color (grey). Use this when the highlighted regions should be distinguished from one another by color — for example when comparing two adjacent AAL3 frontal regions.
[15]:
# select only two parcels and specify colors (any matplotlib color spec works)
# parcels not contained in the mapping get the default color
aal3_color_mapping = {"Frontal_Inf_Oper_R" : "r", "Frontal_Inf_Tri_R" : "g"}

vertex_colors = get_vertex_colors_from_coord(colin_ijk_labeled.brain, "parcel_aal3", aal3_color_mapping)
plot_brain_views_grid(colin_ijk_labeled.brain, vertex_colors)
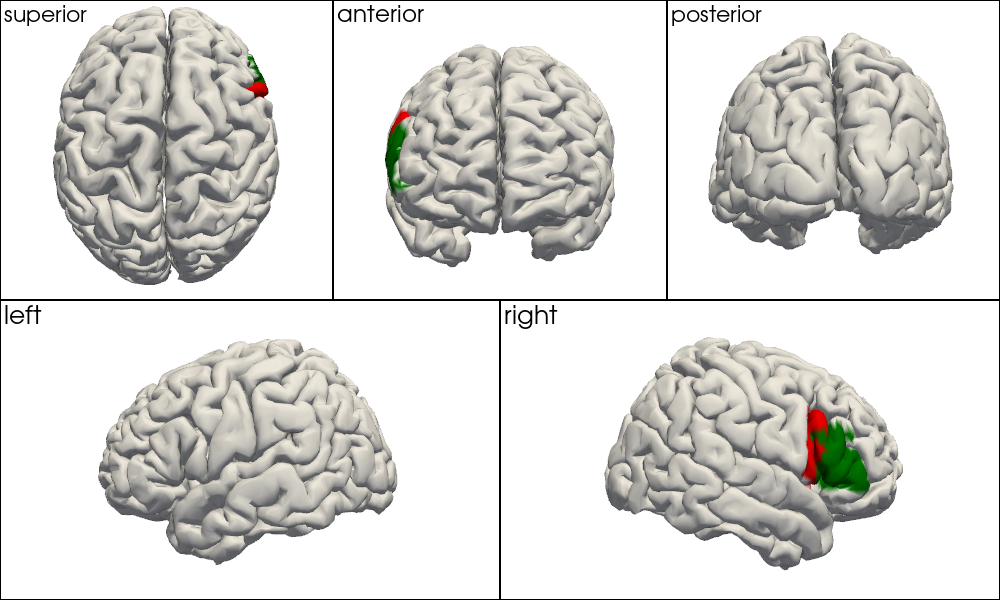
Pattern 2 — highlight a set of parcels in a single color:
Pass a single color string as color_mapping and provide a labels list. Every vertex whose coordinate matches a label in the list gets the specified color; all other vertices get default_color. This gives the clearest signal-vs-background contrast when you want to show, for example, bilateral Broca’s area (BA44 + BA45) against a neutral grey background.
[16]:
# specify only a single color, that will be used for all parcels. Then select only a subset of parcels to color.

vertex_colors = get_vertex_colors_from_coord(
    colin_ijk_labeled.brain,
    "parcel_brodmann",
    color_mapping="r",
    labels=["right_BA44", "right_BA45"],
)
plot_brain_views_grid(colin_ijk_labeled.brain, vertex_colors)

Spot-Check: Verifying Label Assignments at Known MNI Coordinates
As a sanity check we verify that the assigned labels are anatomically plausible at three well-known MNI152 locations. We find the nearest brain surface vertex in MNI152 space and read off its Brodmann label.
MNI coordinate |
Expected region |
|---|---|
|
Occipital pole / calcarine sulcus (BA17/18) |
|
Left somatomotor cortex (BA4/6) |
|
Right prefrontal cortex (BA44/45/46) |
[17]:
tests = np.asarray([
    [-10, -90, 0],
    [-40, -20, 50],
    [40, 20, 30],
], dtype=float)

vertex_coords = icbm_ijk_labeled.get_brain_mni152_coords().pint.dequantify().values
vertex_labels = icbm_ijk_labeled.brain.vertices.coords["parcel_brodmann"].values
_, nearest = KDTree(vertex_coords).query(tests)

for mni, vertex_idx in zip(tests, nearest):
    print(f"MNI {mni.tolist()} -> nearest surface label {vertex_labels[vertex_idx]}")
MNI [-10.0, -90.0, 0.0] -> nearest surface label left_BA17
MNI [-40.0, -20.0, 50.0] -> nearest surface label left_BA3
MNI [40.0, 20.0, 30.0] -> nearest surface label right_BA44
Parcel-Level Summary Tables
TwoSurfaceHeadModel.parcel_summary_from_vertex_coordinate converts the per-vertex atlas labels into a compact table with one row per Schaefer2018 parcel (the parcellation bundled with the head model). For each Schaefer parcel it reports:
Column |
Meaning |
|---|---|
|
Dominant atlas region covering that parcel (plurality vote over vertices) |
|
Number of vertices whose atlas label equals |
|
Total number of vertices in the Schaefer parcel |
|
Coverage fraction ( |
|
MNI152 centroid of a representative vertex from that parcel |
Medial-wall and background parcels are excluded by default because they do not correspond to cortical tissue. The function returns a pandas.DataFrame that can be saved with .to_csv(..., sep='\t') for use in downstream analyses or supplementary tables in manuscripts.
[18]:
colin_ijk_labeled.parcel_summary_from_vertex_coordinate("parcel_aal3", "colin27")
[18]:
| model | parcel | atlas_label | vertex | fsaverage_vertex | mni152_r | mni152_a | mni152_s | matching_vertices | parcel_vertices | fraction_of_parcel | |
|---|---|---|---|---|---|---|---|---|---|---|---|
| 0 | colin27 | ContA_Cingm_1_LH | Cingulate_Mid_L | 6050 | 81691 | -4.194 | -10.030 | 33.413 | 12 | 12 | 1.000000 |
| 1 | colin27 | ContA_Cingm_1_RH | Cingulate_Mid_R | 18544 | 249911 | 5.843 | -8.805 | 33.371 | 11 | 13 | 0.846154 |
| 2 | colin27 | ContA_IPS_1_LH | Parietal_Sup_L | 1219 | 15719 | -28.909 | -75.494 | 47.774 | 10 | 20 | 0.500000 |
| 3 | colin27 | ContA_IPS_1_RH | Angular_R | 13549 | 181020 | 36.346 | -73.024 | 43.556 | 18 | 25 | 0.720000 |
| 4 | colin27 | ContA_IPS_2_LH | Parietal_Inf_L | 4075 | 51449 | -59.949 | -37.912 | 41.309 | 23 | 29 | 0.793103 |
| ... | ... | ... | ... | ... | ... | ... | ... | ... | ... | ... | ... |
| 595 | colin27 | VisPeri_StriCal_3_LH | Calcarine_L | 223 | 3101 | -1.603 | -93.161 | 10.735 | 36 | 50 | 0.720000 |
| 596 | colin27 | VisPeri_StriCal_3_RH | Calcarine_R | 13024 | 174186 | 14.307 | -82.023 | 13.997 | 110 | 110 | 1.000000 |
| 597 | colin27 | VisPeri_StriCal_4_LH | Calcarine_L | 589 | 8138 | -6.291 | -84.121 | 13.808 | 85 | 87 | 0.977011 |
| 598 | colin27 | VisPeri_StriCal_4_RH | Calcarine_R | 13720 | 183134 | 26.726 | -69.642 | 7.819 | 64 | 71 | 0.901408 |
| 599 | colin27 | VisPeri_StriCal_5_LH | Calcarine_L | 381 | 5258 | -0.509 | -89.682 | 6.975 | 21 | 52 | 0.403846 |
600 rows × 11 columns
[19]:
colin_ijk_labeled.parcel_summary_from_vertex_coordinate("parcel_brodmann", "colin27")
[19]:
| model | parcel | atlas_label | vertex | fsaverage_vertex | mni152_r | mni152_a | mni152_s | matching_vertices | parcel_vertices | fraction_of_parcel | |
|---|---|---|---|---|---|---|---|---|---|---|---|
| 0 | colin27 | ContA_Cingm_1_LH | left_BA24 | 6118 | 82796 | -2.442 | -8.436 | 33.461 | 9 | 12 | 0.750000 |
| 1 | colin27 | ContA_Cingm_1_RH | right_BA24 | 18758 | 253120 | 3.221 | -5.799 | 32.801 | 9 | 13 | 0.692308 |
| 2 | colin27 | ContA_IPS_1_LH | left_BA39 | 1219 | 15719 | -28.909 | -75.494 | 47.774 | 11 | 20 | 0.550000 |
| 3 | colin27 | ContA_IPS_1_RH | right_BA39 | 13549 | 181020 | 36.346 | -73.024 | 43.556 | 23 | 25 | 0.920000 |
| 4 | colin27 | ContA_IPS_2_LH | left_BA40 | 4075 | 51449 | -59.949 | -37.912 | 41.309 | 25 | 29 | 0.862069 |
| ... | ... | ... | ... | ... | ... | ... | ... | ... | ... | ... | ... |
| 595 | colin27 | VisPeri_StriCal_3_LH | left_BA17 | 344 | 4710 | -5.828 | -90.400 | 10.766 | 28 | 50 | 0.560000 |
| 596 | colin27 | VisPeri_StriCal_3_RH | right_BA17 | 13024 | 174186 | 14.307 | -82.023 | 13.997 | 109 | 110 | 0.990909 |
| 597 | colin27 | VisPeri_StriCal_4_LH | left_BA17 | 591 | 8168 | -7.531 | -83.706 | 11.621 | 76 | 87 | 0.873563 |
| 598 | colin27 | VisPeri_StriCal_4_RH | right_BA17 | 13720 | 183134 | 26.726 | -69.642 | 7.819 | 59 | 71 | 0.830986 |
| 599 | colin27 | VisPeri_StriCal_5_LH | right_BA17 | 683 | 9407 | 1.304 | -82.129 | 8.227 | 17 | 52 | 0.326923 |
600 rows × 11 columns
[20]:
icbm_ijk_labeled.parcel_summary_from_vertex_coordinate("parcel_aal3", "icbm152")
[20]:
| model | parcel | atlas_label | vertex | fsaverage_vertex | mni152_r | mni152_a | mni152_s | matching_vertices | parcel_vertices | fraction_of_parcel | |
|---|---|---|---|---|---|---|---|---|---|---|---|
| 0 | icbm152 | ContA_Cingm_1_LH | Cingulate_Mid_L | 6306 | 85636 | -3.545 | -2.610 | 31.203 | 8 | 12 | 0.666667 |
| 1 | icbm152 | ContA_Cingm_1_RH | Cingulate_Mid_R | 18374 | 240857 | 3.967 | -8.118 | 30.450 | 18 | 21 | 0.857143 |
| 2 | icbm152 | ContA_IPS_1_LH | Occipital_Mid_L | 783 | 10677 | -30.465 | -78.741 | 40.341 | 14 | 20 | 0.700000 |
| 3 | icbm152 | ContA_IPS_1_RH | Occipital_Mid_R | 13573 | 174981 | 29.782 | -73.129 | 31.792 | 10 | 14 | 0.714286 |
| 4 | icbm152 | ContA_IPS_2_LH | Parietal_Inf_L | 2895 | 38740 | -59.714 | -50.221 | 46.333 | 45 | 48 | 0.937500 |
| ... | ... | ... | ... | ... | ... | ... | ... | ... | ... | ... | ... |
| 595 | icbm152 | VisPeri_StriCal_3_LH | Calcarine_L | 202 | 2951 | -6.776 | -90.375 | 6.044 | 31 | 41 | 0.756098 |
| 596 | icbm152 | VisPeri_StriCal_3_RH | Calcarine_R | 12837 | 164441 | 8.545 | -87.583 | 7.512 | 89 | 102 | 0.872549 |
| 597 | icbm152 | VisPeri_StriCal_4_LH | Calcarine_L | 554 | 7518 | -11.499 | -81.603 | 7.934 | 67 | 71 | 0.943662 |
| 598 | icbm152 | VisPeri_StriCal_4_RH | Calcarine_R | 13479 | 173545 | 23.424 | -74.785 | 7.149 | 43 | 56 | 0.767857 |
| 599 | icbm152 | VisPeri_StriCal_5_LH | Calcarine_L | 383 | 5319 | -7.192 | -86.332 | 5.366 | 32 | 37 | 0.864865 |
600 rows × 11 columns
[21]:
icbm_ijk_labeled.parcel_summary_from_vertex_coordinate("parcel_brodmann", "icbm152")
[21]:
| model | parcel | atlas_label | vertex | fsaverage_vertex | mni152_r | mni152_a | mni152_s | matching_vertices | parcel_vertices | fraction_of_parcel | |
|---|---|---|---|---|---|---|---|---|---|---|---|
| 0 | icbm152 | ContA_Cingm_1_LH | left_BA24 | 5919 | 80515 | -0.747 | -7.566 | 32.542 | 11 | 12 | 0.916667 |
| 1 | icbm152 | ContA_Cingm_1_RH | right_BA24 | 18374 | 240857 | 3.967 | -8.118 | 30.450 | 20 | 21 | 0.952381 |
| 2 | icbm152 | ContA_IPS_1_LH | left_BA39 | 783 | 10677 | -30.465 | -78.741 | 40.341 | 18 | 20 | 0.900000 |
| 3 | icbm152 | ContA_IPS_1_RH | right_BA7 | 13818 | 178245 | 26.570 | -69.859 | 39.936 | 8 | 14 | 0.571429 |
| 4 | icbm152 | ContA_IPS_2_LH | left_BA40 | 2895 | 38740 | -59.714 | -50.221 | 46.333 | 48 | 48 | 1.000000 |
| ... | ... | ... | ... | ... | ... | ... | ... | ... | ... | ... | ... |
| 595 | icbm152 | VisPeri_StriCal_3_LH | left_BA17 | 202 | 2951 | -6.776 | -90.375 | 6.044 | 39 | 41 | 0.951220 |
| 596 | icbm152 | VisPeri_StriCal_3_RH | right_BA17 | 12837 | 164441 | 8.545 | -87.583 | 7.512 | 92 | 102 | 0.901961 |
| 597 | icbm152 | VisPeri_StriCal_4_LH | left_BA17 | 554 | 7518 | -11.499 | -81.603 | 7.934 | 71 | 71 | 1.000000 |
| 598 | icbm152 | VisPeri_StriCal_4_RH | right_BA17 | 13479 | 173545 | 23.424 | -74.785 | 7.149 | 49 | 56 | 0.875000 |
| 599 | icbm152 | VisPeri_StriCal_5_LH | left_BA17 | 383 | 5319 | -7.192 | -86.332 | 5.366 | 29 | 37 | 0.783784 |
600 rows × 11 columns
Optional: Save Summary Tables
The summary tables above are ordinary pandas.DataFrame objects. To write them to disk, set SAVE_TABLES = True in the next cell. Files are saved in the atlas_parcel_summaries/ folder relative to the notebook kernel’s current working directory.
[22]:
from pathlib import Path

SAVE_TABLES = False
OUTPUT_DIR = Path("atlas_parcel_summaries")

if SAVE_TABLES:
    OUTPUT_DIR.mkdir(parents=True, exist_ok=True)
    summaries = {
        "aal3_parcel_summary_colin27.tsv": colin_ijk_labeled.parcel_summary_from_vertex_coordinate("parcel_aal3", "colin27"),
        "brodmann_parcel_summary_colin27.tsv": colin_ijk_labeled.parcel_summary_from_vertex_coordinate("parcel_brodmann", "colin27"),
        "aal3_parcel_summary_icbm152.tsv": icbm_ijk_labeled.parcel_summary_from_vertex_coordinate("parcel_aal3", "icbm152"),
        "brodmann_parcel_summary_icbm152.tsv": icbm_ijk_labeled.parcel_summary_from_vertex_coordinate("parcel_brodmann", "icbm152"),
    }
    for filename, summary in summaries.items():
        summary.to_csv(OUTPUT_DIR / filename, sep="\t", index=False)
    print(f"Saved {len(summaries)} summary tables to {OUTPUT_DIR.resolve()}")
Limitations of the Volumetric MNI Approach
Why parcel borders appear fuzzy on the inflated surface
The volumetric-to-surface label transfer is inherently approximate. The label of a brain surface vertex is determined by the nearest labelled voxel in 3-D MNI152 space. Because sulcal folds can bring two cortically distant regions to within a few millimetres of each other in 3-D, vertices near a sulcal wall may be assigned the label of the anatomically adjacent — but cortically distant — region instead of their own.
This artefact is most visible on the inflated surface: inflation changes vertex positions in 3-D while leaving labels fixed. Vertices that sit at the fundus (bottom) of a deep sulcus can therefore show “bleeding” — incorrect labels — at the inflated parcel border, even though the label assignment on the folded pial surface appears correct.
The mni_eps search radius controls the trade-off: a smaller radius reduces cross-sulcal contamination but increases the number of vertices that receive 'Background' (no labelled voxel found within reach). The default of 5 mm is a practical compromise for atlases with 1 mm isotropic voxels.
When to use FreeSurfer-based labeling instead
For applications where parcel boundary precision matters — for example when comparing fine-grained DOT image reconstruction results to specific cortical regions, or when building a classifier that relies on exact parcel membership — surface-native labeling via FreeSurfer is the more accurate alternative.
FreeSurfer [Fis12] assigns parcels directly on the cortical surface mesh by registering each vertex to the fsaverage template, where parcel boundaries are defined as vertex-level annotations. Because the boundary is expressed in the same surface space as the vertex, no voxel-lookup approximation is introduced and region borders are exact, even on the inflated surface.
Cedalion provides a complete FreeSurfer-based pipeline for individualized head models in 43b_individualized_head_models.ipynb, which walks through FreeSurfer cortical reconstruction, registration to fsaverage, and surface-native parcel annotation. The standard Colin27 and ICBM152 models were built with exactly this pipeline; their bundled parcel coordinate (Schaefer2018) is a surface-native annotation — which is why Schaefer borders look sharper
than AAL3 or Brodmann borders on the same inflated surface.
Practical guidance:
Use case |
Recommended approach |
|---|---|
Quick atlas comparison, ROI definitions, group-level reporting |
Volumetric MNI lookup (this notebook) |
High-precision boundary analysis, individual MRI available |
FreeSurfer surface-native labeling |
Bridging a new atlas to an existing surface-native parcellation |
Volumetric MNI lookup, compare overlap with Schaefer via |
References
[23]:
cedalion.bib.dump_to_notebook()
Methods used
| [1] | Holmes1998 | cedalion.data.get_colin27_headmodel_files | Colin J. Holmes, Rick Hoge, Louis Collins, Roger Woods, Arthur W. Toga, and Alan C. Evans. Enhancement of mr images using registration for signal averaging. Journal of Computer Assisted Tomography, 22(2):324–333, March 1998. doi:10.1097/00004728-199803000-00032. |
| [2] | Fischl2012 | cedalion.data.get_colin27_headmodel_files, cedalion.data.get_icbm152_headmodel_files | Bruce Fischl. FreeSurfer. NeuroImage, 62(2):774–781, 2012. doi:10.1016/j.neuroimage.2012.01.021. |
| [3] | Schaefer2018 | cedalion.data.get_colin27_headmodel_files, cedalion.data.get_icbm152_headmodel_files | Alexander Schaefer, Ru Kong, Evan M Gordon, Timothy O Laumann, Xi-Nian Zuo, Avram J Holmes, Simon B Eickhoff, and BT Thomas Yeo. Local-global parcellation of the human cerebral cortex from intrinsic functional connectivity mri. Cerebral cortex, 28(9):3095–3114, 2018. doi:10.1093/cercor/bhx179. |
| [4] | Fonov2011 | cedalion.data.get_icbm152_headmodel_files | Vladimir Fonov, Alan C. Evans, Kelly Botteron, C. Robert Almli, Robert C. McKinstry, and D. Louis Collins. Unbiased average age-appropriate atlases for pediatric studies. NeuroImage, 54(1):313–327, January 2011. doi:10.1016/j.neuroimage.2010.07.033. |
| [5] | Rolls2020 | cedalion.data.get_atlas_files | Edmund T. Rolls, Chu-Chung Huang, Ching-Po Lin, Jianfeng Feng, and Marc Joliot. Automated anatomical labelling atlas 3. NeuroImage, 206:116189, 2020. doi:https://doi.org/10.1016/j.neuroimage.2019.116189. |
| [6] | Mai2017 | cedalion.data.get_atlas_files | Jürgen K. Mai and Milan Majtanik. Human Brain in Standard MNI Space: Structure and Function: A Comprehensive Pocket Atlas. Academic Press, an imprint of Elsevier, London ; San Diego, CA, 2017. ISBN 978-0-12-811275-5. |